Tin Industry Primer: Part 1
A Pareto Approach to Industry Analysis
Tin is one of the world’s smallest, most obscure commodity markets at $9B in total value. Because of its small size, it remains off the radar to most traders, investors, and institutions.
We believe that tin today is where uranium was in 2016.
All the easy tin has already been mined. What’s left is lower grade, higher-risk, more complex, and more expensive to extract. This makes it almost impossible to bring new supply online when most of the industry’s largest producers are reducing output.
The result is a Trifecta Commodity Setup where we can make a ton of money over the next 3-5 years taking advantage of this hidden, under-invested corner of the global commodity market.
Our goal with this 80-20 Industry Primer is to create a simple but robust global supply and demand model. From this, we can answer the most critical questions surrounding the Tin Thesis:
Supply: How much supply is there currently, where will new supply come from, and how much will there be in 1-2 years?
Demand: Who’s currently buying the supply, how much are they buying, and how will their buying habits change over time?
Price: How do all of these changes affect the price of tin?
We develop deep conviction by doing our own work, stress-testing it against industry experts, and continually updating our models in the face of new evidence.
It’s this conviction that will allow us to hold our position during the inevitable drawdowns along the super cycle. Let’s get after it.
The Supply Side: Primary & Secondary Deep Dive
To understand the future of any commodity industry, it is vital to understand its past. Let’s look at historical tin production.
History Of Tin Production & Use Cases
Tin is one of the oldest metals produced, with the first mining operation in Turkey around 3500 B.C. The metal kickstarted the Bronze Age, where societies mixed copper and tin to make bronze for armor, jewelry, and weapons.
Like uranium, we can categorize tin’s history into three main boom periods:
Period 1: Cars & Cans (1900 – 1930)
Period 2: Post-War Reconstruction (1945 – 1970)
Period 3: Electronics & Lead-Free Solders (1990 – 2010)
Demand for most industrial metals, like copper, track global GDP growth. Tin, however, grows in fits and starts, relying on consumer or industrial inventions to spur growth.
That brings us to today. There are six main use cases for tin:
Soldering (49%)
Chemicals (18%)
Tinplate (12%)
Batteries (7%)
Alloys (5%)
Other (9%)
We can think of soldering as the glue that holds all consumer electronics together. The circuit boards in your car, TV, or whatever device you’re reading this on use tin soldering.
As the above graph shows, tin soldering exploded in the early 2000s after the US banned lead as the “glue” for soldering in 2006. Apparently, ingesting lead in large quantities is not suitable for the population.
This lead ban also coincided with massive demand in consumer electronics (hence the spike from 200Kt to 350Kt in annual demand).
There are two reasons why tin is a great consumer electronics glue. First, it is highly conductive and has a low melting point (449.5 F). Second, it’s cheap compared to available substitutes like silver or gold.
Over time, soldering will maintain its ~50% share of tin demand. But we’ll dive deeper into that topic later on.
For now, we can think of tin as entering its fourth phase … The Great Electrification.
Let’s dive into supply.
Primary Supply: Global & Country-Specific
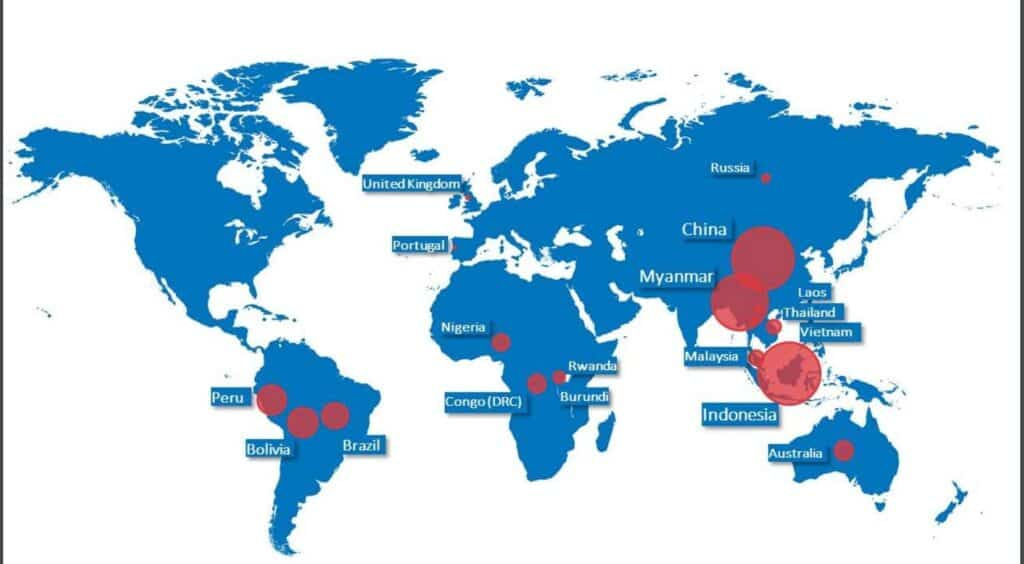
The uranium similarities are everywhere, starting with global supply. Tin supply is highly concentrated. 75% of supply comes from four countries:
China (31%)
Indonesia (21%)
Myanmar (14%)
Africa (9%)
The remaining 25% of the supply is split between South America (17%) and “Other” (8%).
I know what you’re thinking. These countries read like a Jack Ryan four-season roadmap.
The map below highlights the global supply concentration.
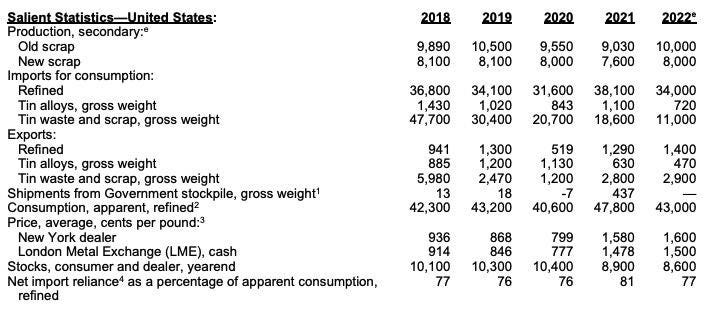
Historically, the same four countries have dominated global supply, and we don’t see that changing anytime soon. The United States, for example, has zero tin mines in operation and no projects in the pipeline. Canada also has no operating tin mines or future projects.
In other words, North America relies on a Quentin Tarantino cast of countries for almost 100% of its supply. But part of that is due to tin’s intrinsic and unique properties.
Unlike other base metals (copper, iron ore, etc.), economically viable tin ore concentrates are restricted to a few geographic areas, which include China, Myanmar, and Indonesia. So even if the US wanted its domestic supply base, it’s out of luck.
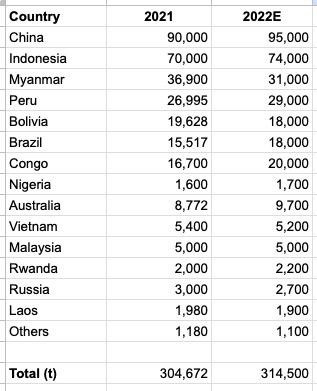
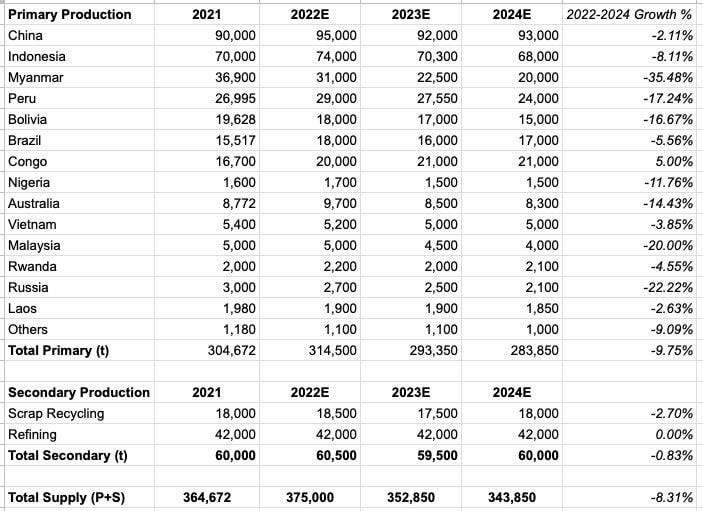
We can create a basic map of country-level supply as of 2021 with 2022 estimates (see below data from the US Geological Survey).
As we’ll explain next, tin has unique mining and extraction techniques that decrease reliability and increase complexity and cost, especially for large producers like Indonesia.
Mining, Extracting, And Processing Tin
There are two primary ways to mine tin. The first and most conventional way is through underground mining. The second and most common way for tin, specifically, is via gravel pumping. I had never heard of gravel pumping before. But I love how Britannica describes the process (emphasis added):
“In this method, the barren overburden is removed, often by draglines or shovels, and high-pressure water jets are used to break up and dislodge the tin-bearing sand.
A submerged gravel pump then sucks up the slurry of mud and water and raises it to a series of sluice boxes, or palongs, which slope downward and have baffles placed at intervals along their length.
As the slurry flows along, the heavier minerals, including cassiterite, fall to the bottom, while the lighter waste material flows over the end of the boxes to tailings dumps. Periodically the flow is stopped and the crude concentrate removed.”
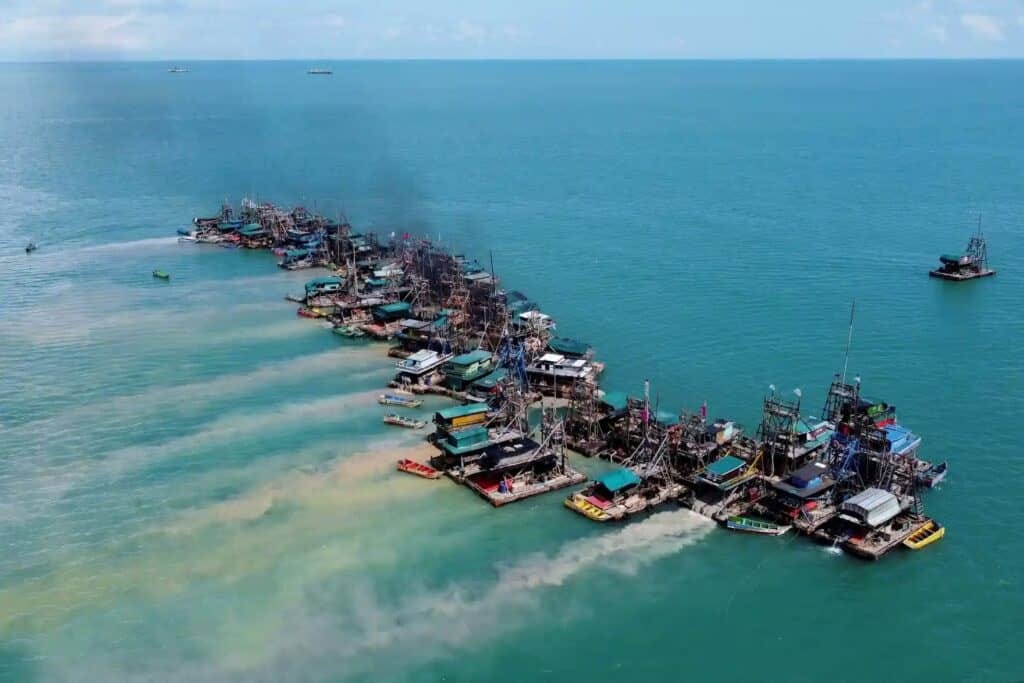
Offshore dredging is what it sounds like, and it’s the most jerry-rigged mining method I’ve ever seen. You take a small wooden fishing boat, attach a giant diesel engine to the back, and add a makeshift wooden rig that looks like an oil derrick.
The Guardian did a great piece on offshore dredging, which you can read here.
If you’re thinking, “Wow that doesn’t look stable/safe/reliable/low-cost at all,” you’re right. Unfortunately, for mega-producers like Indonesia, this is their future. All the easy, high-grade tin has been mined onshore. What’s left is this offshore McGeyver experiment.
Next, let’s examine supply on a company and mine level.
Company And Mine Concentration
The top ten largest tin producers account for 75% of global production (furthering the uranium similarities).
Four of the top ten largest producers are Chinese companies (Yunnan Tin, Yunnan Chengfeng, Jiangxi New Nanshan, and Guangxi China Tin).
Peak Tin: The Best Days Are Behind The World’s Largest Producers
From the 1980s until around 2002, China was the fastest-growing tin producer in the world. Much of that was due to the country’s significant tin discoveries in places like Gejiu. Gejiu had 900,000 tons of tin reserves at its peak, which it didn’t start mining until the 1950s.
However, Gejiu has become the poster child for what’s happening in China. Reserves are depleting at an alarming rate. For example, Gejiu was “tin bankrupt” by 2008, with ~10% of its former 900,000-ton reserve base left.
The result is 20 years of stagnant tin production with the remaining ore being lower-grade and more expensive to extract.
Indonesia, the world’s second-largest producer, faces similar problems. All the easy ore has been mined. What’s left is offshore dredging. PT Timah is a state-owned operator and Indonesia’s largest producer.
Here’s an example of all the easy tin being mined in numbers. In 2006, PT Timah produced 45kt of tin. In 2021, they produced just 26.5Kt.
This happens when you switch from high-grade, lower-cost mining to lower-grade, higher-cost mining in complex areas like offshore dredging.
Every major global producer faces these same challenges.
Myanmar has a reserve issue and hasn’t invested in production with tin under $30K/t.
South American supply peaked in 1988, came close in 2004, but then trailed off to ~50Kt today.
Africa has one legitimate producer: Alphamin Resources (AFM)
Australia has one mine in operation (Renison Bell) that generates 8Kt per year.
When you look at the data and the trajectory for the world’s largest producers, it’s hard to feel anything but bearish about future primary production.
What about secondary supply?
Secondary Supply: What It Is & Where It Comes From
Tin has two sources of secondary supply: scrap recycling and scrap refining.
Scrap recycling accounts for ~18Kt in annual supply, with ~52Kt coming from refined secondary tin.
That would require refineries and recycling facilities to operate at near maximum capacity, which is something they haven’t done historically. We’ll assume ~60Kt in annual supply in our model.
Future Tin Projects
I’ll repeat what I say for every commodity thesis … yes, in theory, this enough tin in the world to meet our wildest demand expectations. The problem, of course, is incentive prices, government policies, geographic feasibilities, and public sentiment.
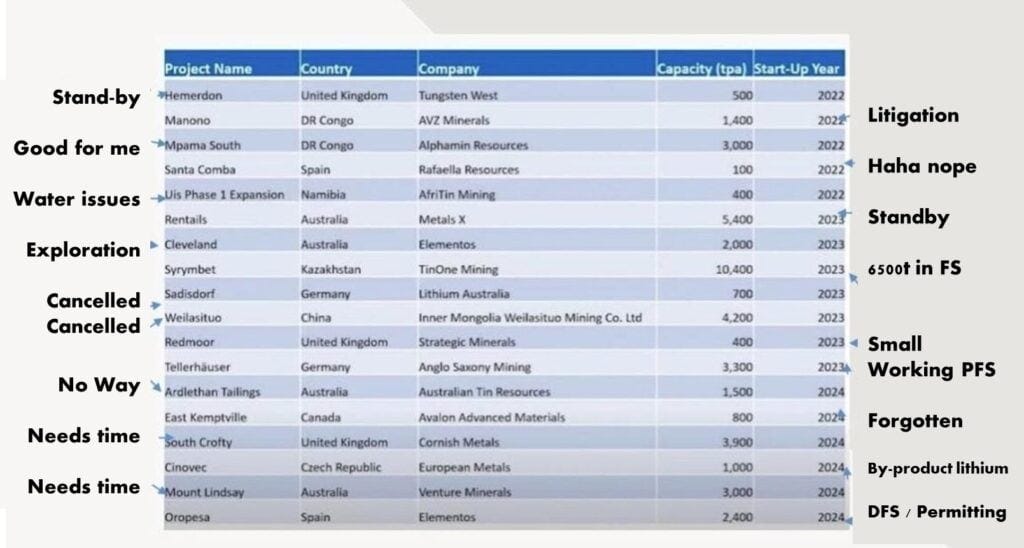
Adrian Godas explained the issues with tin’s project pipeline (see slide below, edit: updated image to reflect Elementos DFS/permitting position).
Adrian estimates the industry will add ~34Kt in annual supply by 2026. The reason for the expectations gap is the incentive price.
Tin trades at ~$24K/t or below the $30K/t marginal cost of production curve (see below).
In other words, there’s no incentive to bring new supply to market until tin prices pass $30K/t.
Making The Supply Side Of Our Model
Our job is to estimate what supply will look like over the next 18-24 months.
I assume that primary production will decline by ~9% from 2022 to 2024, or roughly 4.5% annually. This includes the shift from onshore to offshore dredging in Indonesia, falling grades and reserves in China, and a lack of new mine supply coming online.





To be more accurate on the future supply: LSE listed First Tin owns and has been developing Tellerhauser in Germany and also Taronga in Australia (DFS to be published in 2024).