


DOTM Calls
A primer on when to purchase deep out-of-the-money call options on an underlying equity:

Recently, we’ve expressed some of our equity views with deep, out of the money (DOTM) options over plain vanilla stock. One of our Operators in the Collective has been doing this the whole year and has been killing it.
The returns on the winners can be massive — in the 10-20x range. For example, take our pick from the 2017 August MIR, Interactive Brokers. The stock has shot up 32% since we recommended it — not a bad gain over just two months.
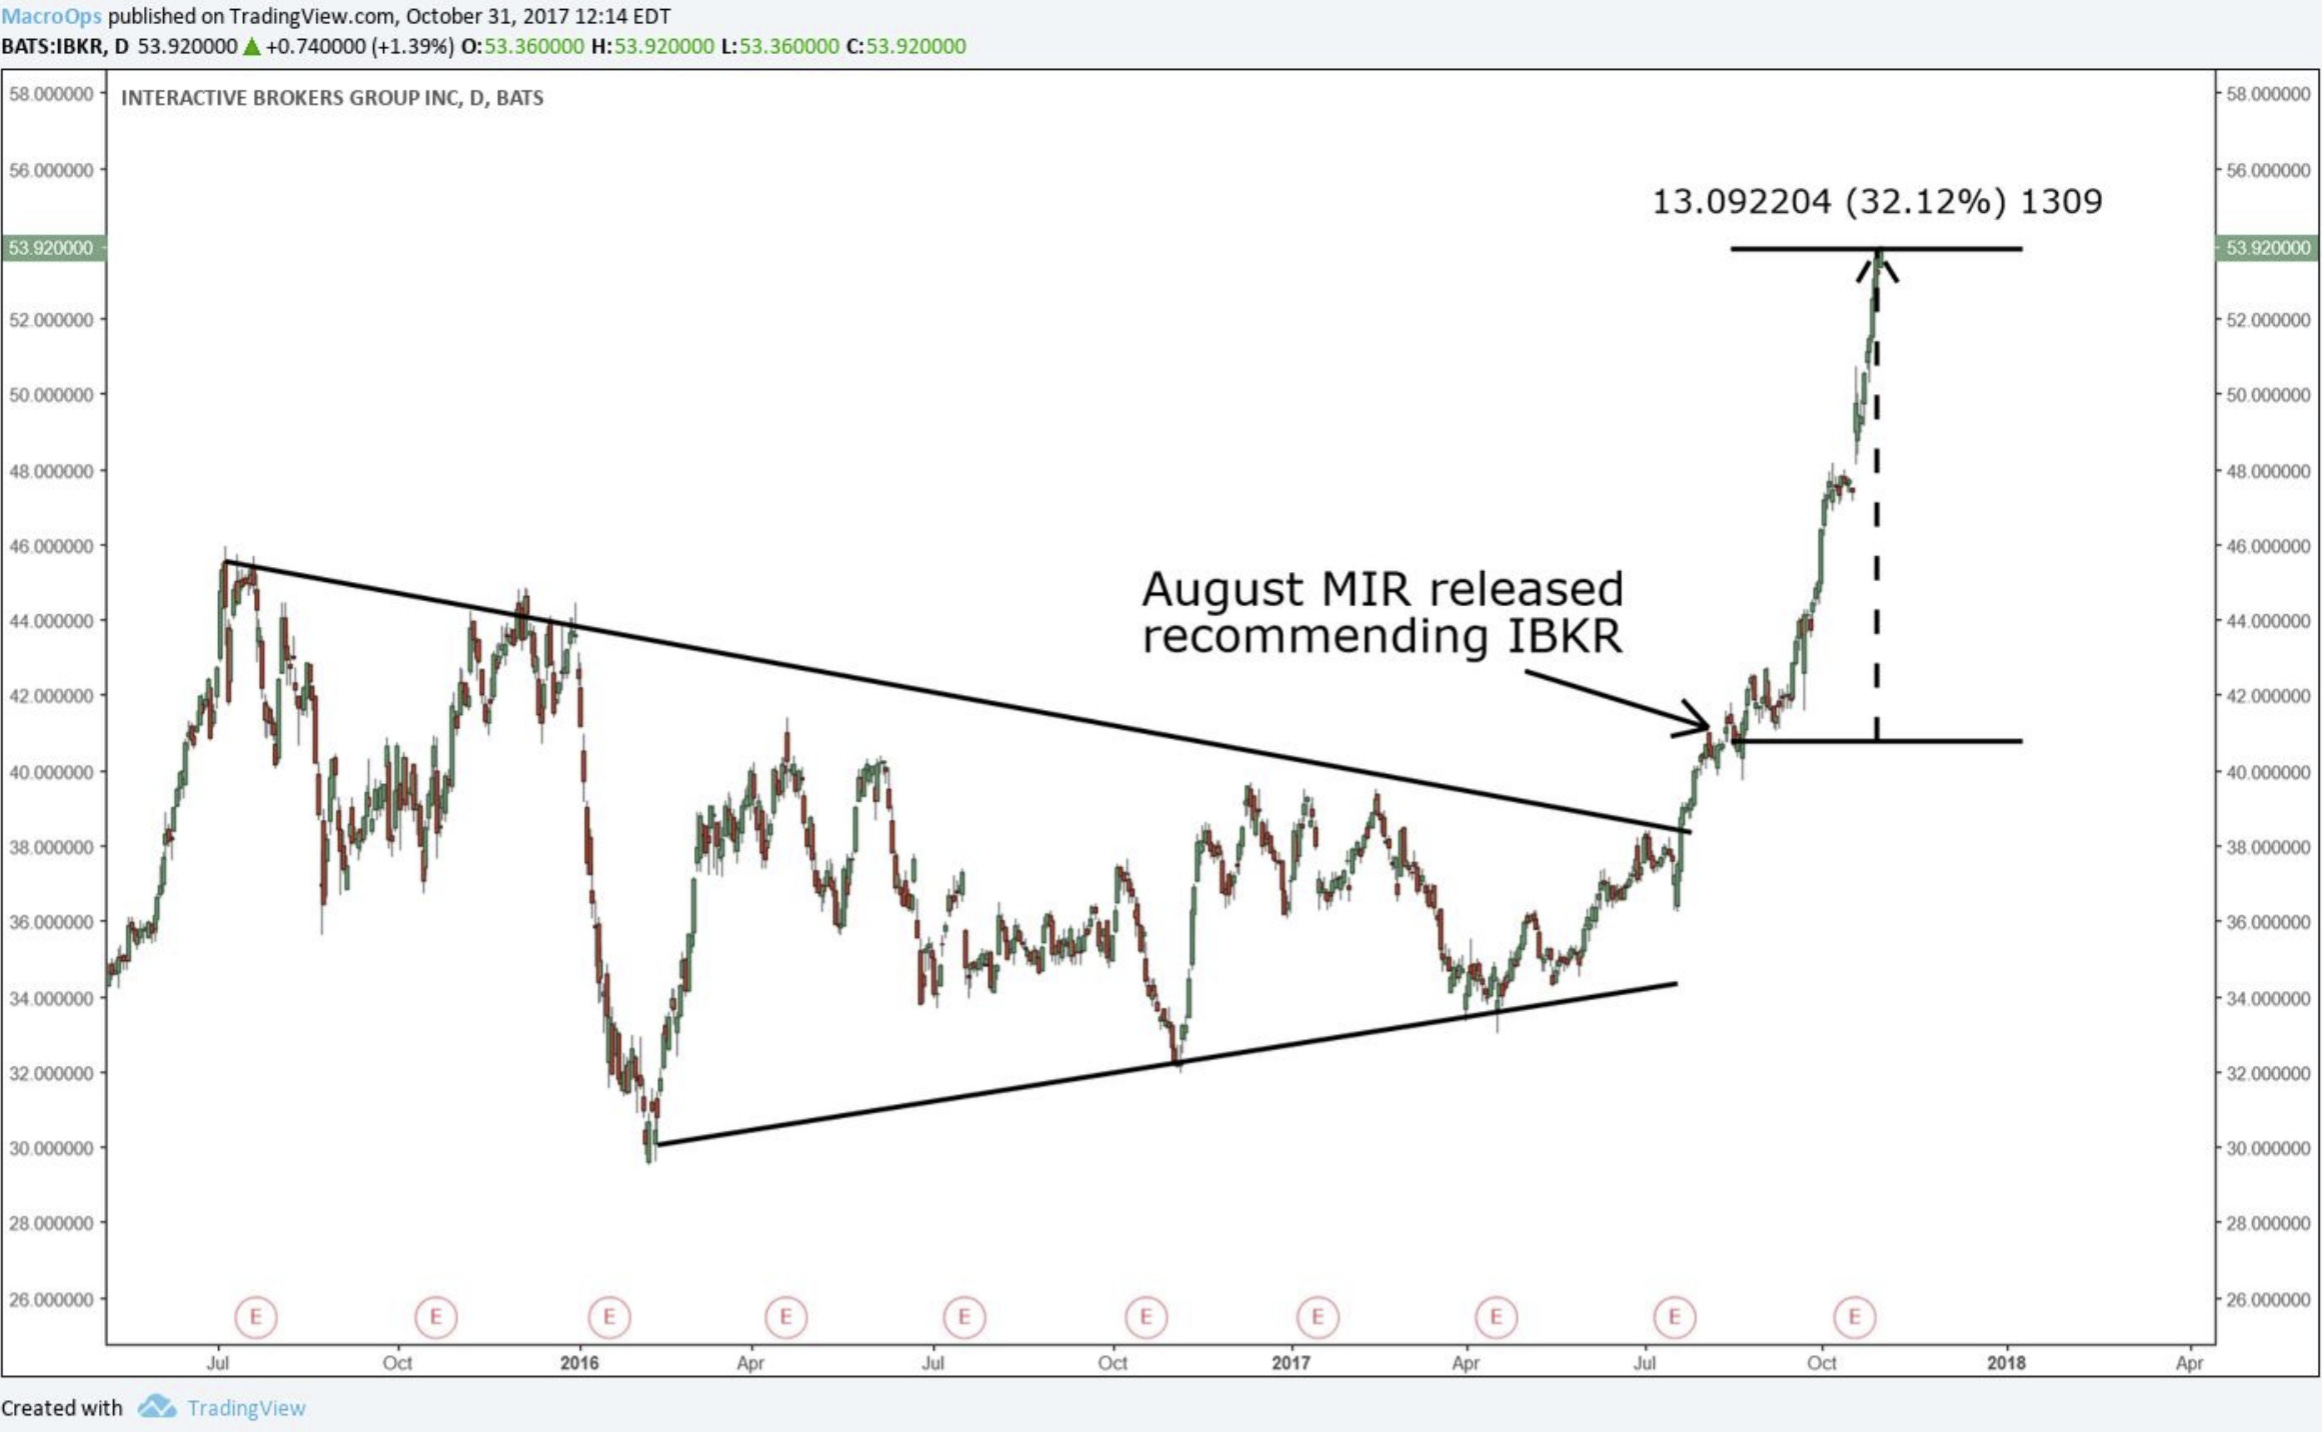
But if you would have bought the March 2018 calls struck at $49 for $.30 at the same time, you’d be up 20x as those calls sold for $6.10.
A 20x winner makes up for a lot of losers… which is why this is such an interesting strategy. Greater return to risk asymmetry is an advantage.
In the later innings of a market cycle, like we’re in now, hot stocks tend to gain momentum and have a tendency to turn parabolic. These steep moves bring in the FOMO chasers and then the stock eventually turns and wipes out months’ worth of gains. It’s these sharp washouts that keep a lot of traders from buying into strength.
But by using calls, that washout risk isn't an issue since you’re only on the hook for what you pay in premium. The key in buying these out of the money calls is selecting the right expiry. Short-dated options are notoriously overpriced. You’re better off selling those options than buying them. But the long-dated options (6 months+) tend to be more reasonably priced on the stocks with great technical and fundamental momentum.
This is because the Black-Scholes model assumes that all stocks have an equal chance of going higher as they do lower. The math behind Black-Scholes implies that trends don’t exist and that day to day fluctuations are random.
Take a look at the probability distribution for April calls on Apple stock below.

The pink shaded area represents the likelihood that Apple falls into that particular price range by expiration. You can see that it’s fairly symmetrical. The amount of shading on the right is about the same as the amount to the left. Also note that the market implied forward price is right near the price that Apple is currently trading.
Now let’s say we believe Apple actually has positive price and fundamental momentum. We believe trends exist and that Apple will continue its uptrend higher over time. If our assumption is true, the probability of the stock moving higher than it is today is much greater than what the above distribution implies. The correct distribution should instead look something like this:

The red shading represents the probability of Apple reaching those prices if we assume that the current trend persists. The difference between the red and the purple areas are what we call edge. The market is implying a low probability of higher prices while we think the likelihood is significantly higher. We can buy the out-of-the-money calls in this situation and show a profit over time.
Also notice that the “custom” forward price is higher than the market implied price. The option market always assumes no trend — and in this hypothetical example, we think otherwise. It’s important to understand that these edges, i.e. the discrepancy between the red area and the purple area, are more likely to occur in options with more than 6 months left to expiry.
Long-term momentum is a factor that the options market regularly misprices. By buying long-dated DOTM call options on stocks, you have a position that will slowly add exposure as the stock moves your way. Think of it as a little trading assistant who automatically adds to winners. This positive convexity is what creates the outsized returns like we saw with IBKR.