

Checking In On Classical Charting

***The MO port is up +37% ytd, and we’re not seeing a shortage of great opportunities in this market. If you’d like to join me, the MO team, and our Collective of sharp, supportive investors and traders as we navigate these markets, then click the link below. I look forward to seeing you in the group.***
Join The Collective
Earlier this summer, I wrote about my classical charting trading system and its performance through July 31, which posted a +29R.
If you’re a new Collective member, you’re probably thinking, “Wait. I thought Brandon was the value guy who tries to find cheap miners and stuff.”
I am!
But I’m also a chartist, bitten by the Edwards & Magee bug a decade ago, and I can’t shake it. I love trading classical charting patterns. In fact, it’s one of the reasons I joined Macro Ops and why I instantly connected with our Trifecta Lens approach. It combines Fundamentals (value), Sentiment (psychology), and technicals (yay patterns!).
Also, I couldn’t not write about classical charting after we announced that Mike G joined the MO team! I know I said this last time, but Mike G is the reason why I have this trading system. He’s why I only trade horizontal patterns, use the BAT tool, and the 8EMA hard stop rule.
This week, I review my YTD system performance through November 25, 2025, to see if anything stands out.
Here’s a quick overview of my classical charting system.
High-Level System Overview
The What: I trade classical chart patterns, mainly horizontal boundaries: rectangles, ascending/descending triangles, cup-and-handle, and H&S patterns.
The How: I use Mike G’s Breakout Automator Tool (or BAT) to identify entry, exit, and profit-taking points.
The tool takes the neckline of the pattern boundary and stretches to the base of the pattern (so the bottom of the rectangle, above/below the right shoulder of an H&S, below the handle, and the lowest/highest point of an ascending/descending triangle).
I risk 1R on each trade (if I can get the size). My BAT profit target ensures a 4R profit if hit.
Finally, I trail stop my position using the 8D EMA.
The Why: Classical charting works, and I want to systematically exploit that edge by trading the boundaries of horizontal patterns using the BAT tool.
One important note before we dive in, I track both total trades and exclusively rectangle trades. This allows me to see how well a rectangle-only system performs compared to trading all available patterns.
To the data.
YTD 2025 Return Data (as of November 25)
Here are the raw performance data for my classical charting system through November 25, 2025 (the most recent closed trade).
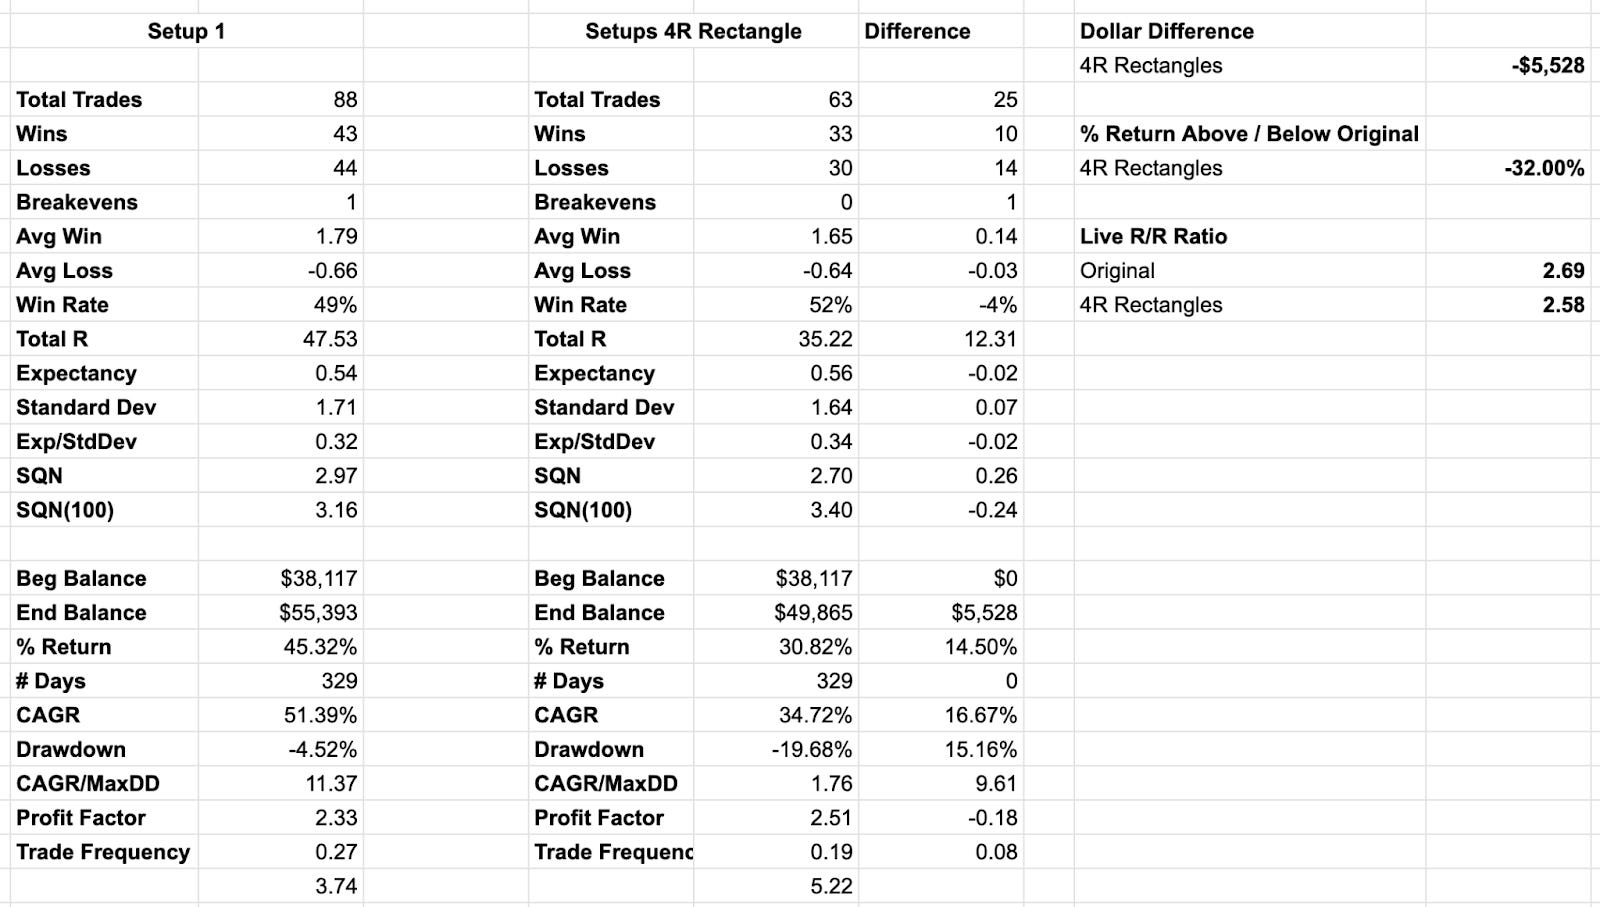
A few highlights on Setup 1:
Win Rate: 49% (1% drop from prior)
Average Win: 1.79R (down from 1.92R)
Average Loss: -0.66R (0.02R improvement from prior period)
Total R: 47.53 (up from 29.13R)
Expectancy: 0.54 (down from 0.63)
Total Return: 45.32%
CAGR: 51.39%
My real-time “R/R ratio” is 2.69x for my original system and 2.58x for the rectangles-only system. In other words, on average, my wins are 2.69x the size of my losses.
Check out the equity curves of both systems below.
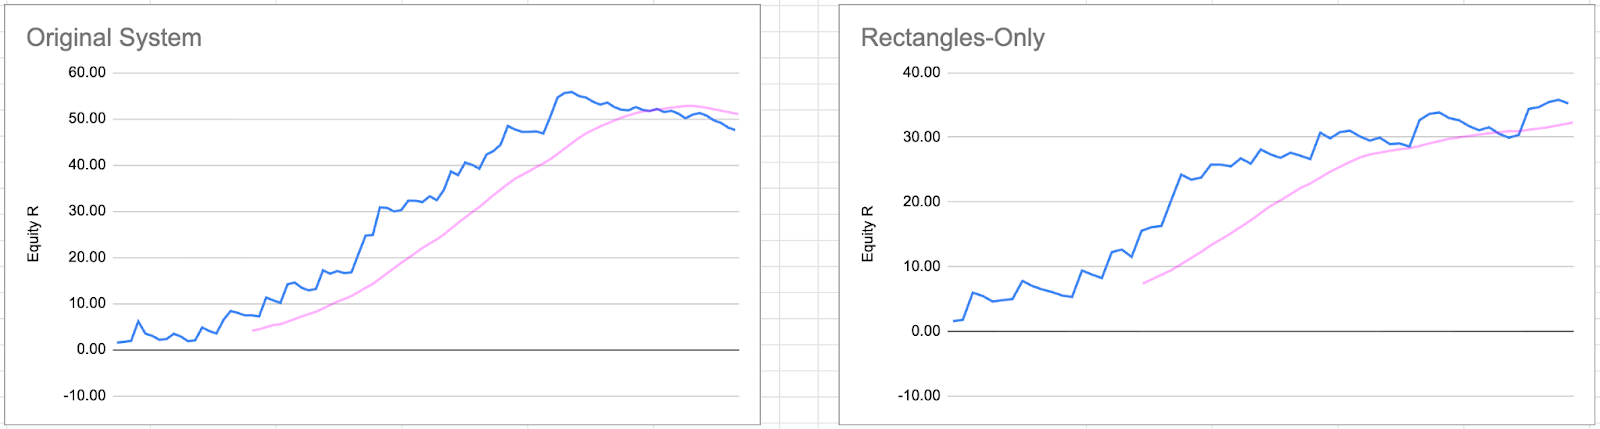
I liked the YTD July equity curve (or EC) more than this one. July had a nice, stair-step pattern. And while this is still good (45R, so can’t complain too much), I’ve slowly bled from my EC highs and now “trade” below my EC 20-period moving average.
Death by a few dozen paper-cuts? Here’s a screenshot of my last fourteen closed trade entries (see below).
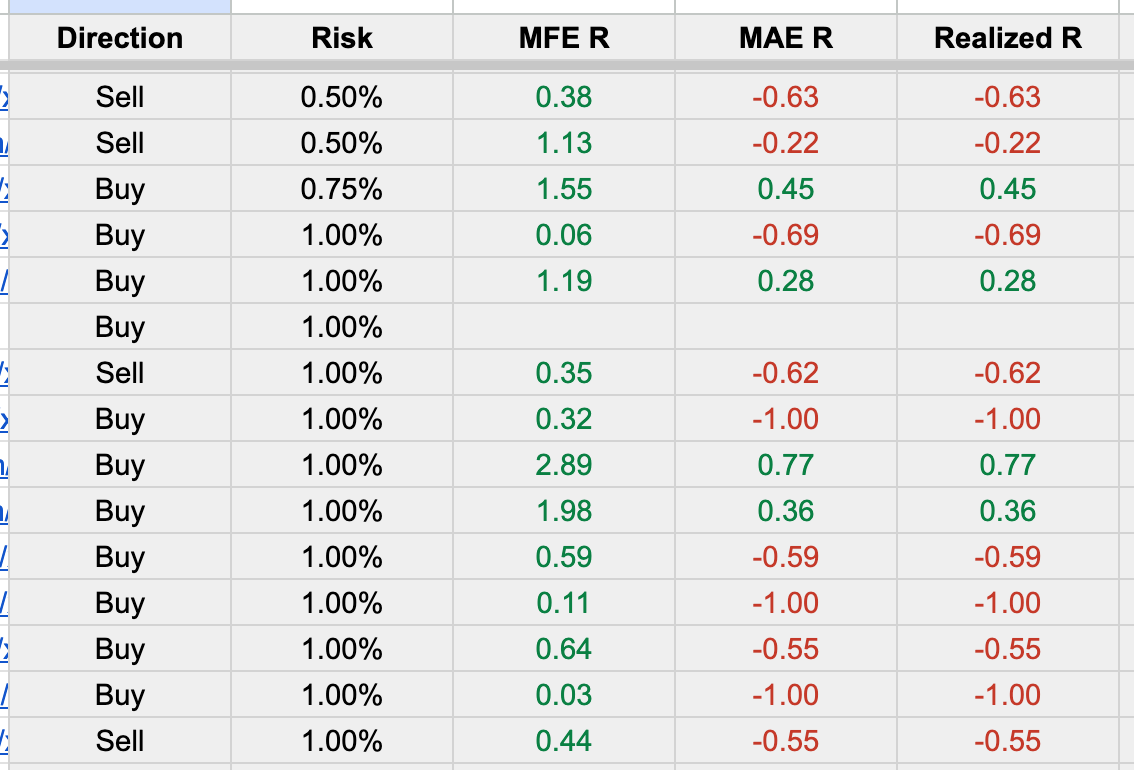
Lots of red on the spreadsheet. Is this frustrating? Of course. But does it make sense? Yes.
We’re in a sideways/chop market environment. Guys like Chris D make a killing in this regime, mean-reverting long/short at range tops/bottoms. Breakout traders like myself? Not so much.
New Goal: Don’t Lose (Too Much Money)
Not losing money means taking only the best setups. What do those look like?
Horizontal pattern boundary: I will shift my preference even more towards rectangles.
No buying overextended patterns: I won’t buy a chart if the 200MA is outside the lowest point of the BAT tool (Mike G’s definition of overextension).
Buying patterns with advancing 8EMAs: I want to buy a chart where I move my stop to <1R loss after one trading day.
That’s my goal for the next month of trading … take the best setups and try not to lose too much money if my system is out of sync with the market.
Let’s get back to the data, because there’s still a lot to discuss from the past four months.
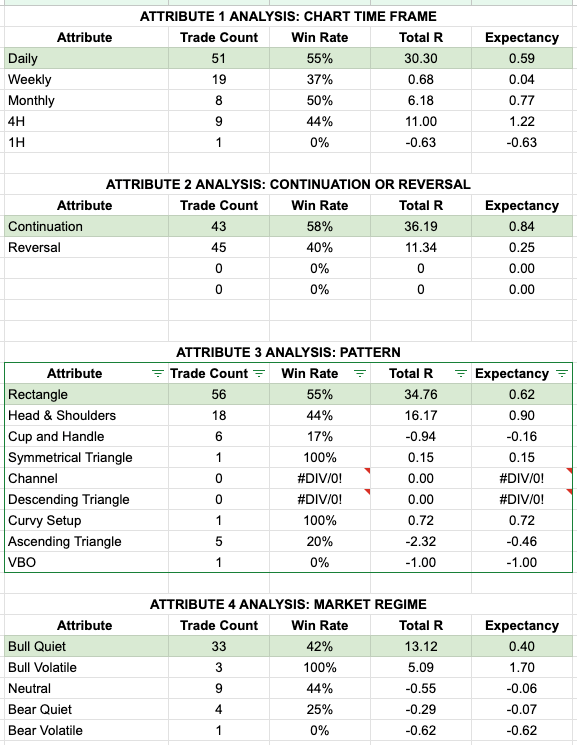
Time Frame & Trend Type Insights
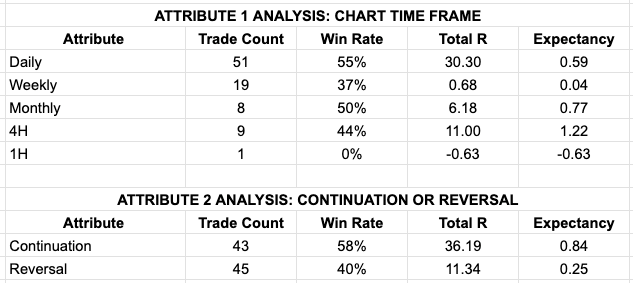
Daily charts remain the highest win-rate time frame at 55%, and since I’ve taken 51 trades off that time frame, it’s generated the highest Total R at 30.30.
Despite placing only nine trades on the 4HR time frame, it’s generated 11R with a 1.22 expectancy (granted, most of that outperformance came from oil’s spike during the initial Israel/Iran conflict).
Also, there’s no hiding it. I took a trade on the 1HR time frame. So dumb. I got excited about the 4HR time frame and thought, “If the returns are this good at 4HR, I bet they’re even better on the 1HR. Just think of how many more setups I’d find!”
Glad I got that out of my system for only a -0.63R loss.
The Continuation vs. Reversal data shouldn’t shock anyone. Momentum begets momentum. Once you “look left” on a chart, you realize why continuation patterns perform better than reversals.
Reversals often have mountains of selling pressure to climb before reaching escape velocity (i.e., anywhere near the 4R target). Continuation patterns usually break out to new monthly, 52W, or all-time highs … nothing but clear skies and happy shareholders.
Pattern & Market Regime Analysis
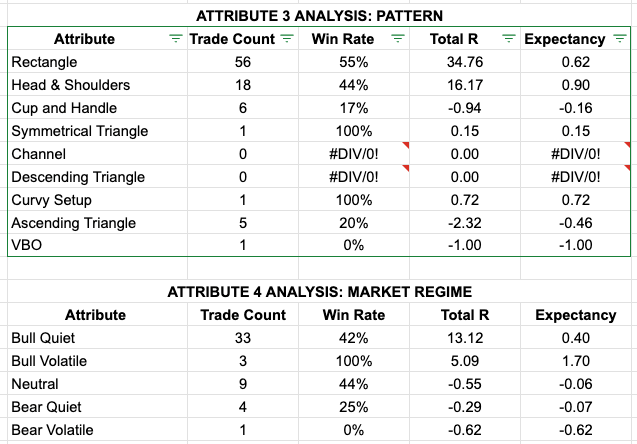
A few things to note from the last report:
Rectangles keep crushing it: I added 26 rectangle trades since July 31, increasing my win rate from 50% to 55% while maintaining the same 0.62 expectancy.
Head & Shoulders Falter: I added nine H&S trades and decreased my win rate from 56% to 44% and my expectancy from 1.17 to 0.90.
Bear Market Regimes are hard: I’m adding Market Regime data to my 2025 trade log, but I only have it from June onwards. Since that time, I’ve lost money trading bear market regimes (-0.29R Bear Quiet and -0.62R Bear Volatile). It will be interesting to see what the full-year data shows once complete.
Seasonal Trading Data: Monthly View
I don’t know why it took me this long to add monthly total R data to my spreadsheets.
Here is the monthly return data from August to November 25th.
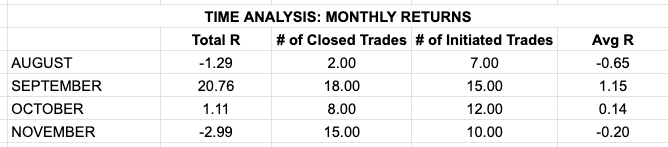
Lol at September.
I like this data because it shows when my system loses sync with the market (November), allowing me to adjust in real time based on actual data, not just “vibes.”
Using Your Data To Improve Your Trading
Mike G dropped a lot of knowledge bombs in his two MOHOs. But the most crucial bit was his thoughts on using your trading data to improve your trading.
Let’s use my YTD results as an example of how I can improve my trading in December.
I told you that my goal for December is not to lose money. Here’s the best part: my data already told me how I can do that.
Look at my most profitable, highest win-rate/expectancy attributes:
Time Frame: Daily chart
Continuation or Reversal: Continuation
Pattern: Rectangle
Market Regime: Bull Quiet
The answer lies in your trading data (see below).
My trading improved dramatically the day I became serious about documenting all the necessary performance data I needed to succeed.
If you have a year’s worth of trading data already, fantastic! If you don’t, start today. Get the reps in so you can start 2026 on a strong foot.
I smell a future MOHO in the works with Mike G on this very concept, and I can’t wait.
Your Value (and Classical Chartist) Operator,
Brandon